SafeLab: an IoT Project
Introduction
This project was created for the Internet of Things course 19/20 of the University of Bologna.
Requirements
We want to create an ambient intelligence system based on IoT devices and technologies for monitoring environmental parameters and people inside a room (e.g. IT laboratory). Specifically, the system must be able to:
- Count the number of people currently present in the room. The detection must be carried out using appropriate sensors (eg. PIR sensors) located near the passage/access door; obviously, it is necessary to distinguish entry/exit events from the passage. The use of cameras and computer vision techniques is not required.
- Detect and acquire environmental parameters of the room, such as temperature, humidity, and pressure.
- Provide for the storage of the acquired data (number of people in the environment, environmental parameters mentioned above) in an appropriate time-series database created in INFLUX 2.0.
- Provide suitable interfaces for displaying sensor data using Grafana, or using custom interfaces.
- Provide forecasting techniques for the number of users in the room (in other words: predict how many users will be present in the room in the next X minutes) and the value of the environmental sensors. The forecast values must be stored using a time-series database (eg. Influx).
- Provide alerting mechanisms when the following alarm situations are detected: (i) the number of users is greater than a pre-established threshold; (ii) the temperature/humidity/pressure values are higher / lower than reference thresholds. The alarm notifications are addressed to the facility administrator and can consist of sending an email, an invocation of the REST API, a message on the TELEGRAM profile, etc. (the group chooses the type of notification).
Moreover, we have set ourselves the aim of implementing the system using low-power and low-cost sensors and development boards.
Proposed solution
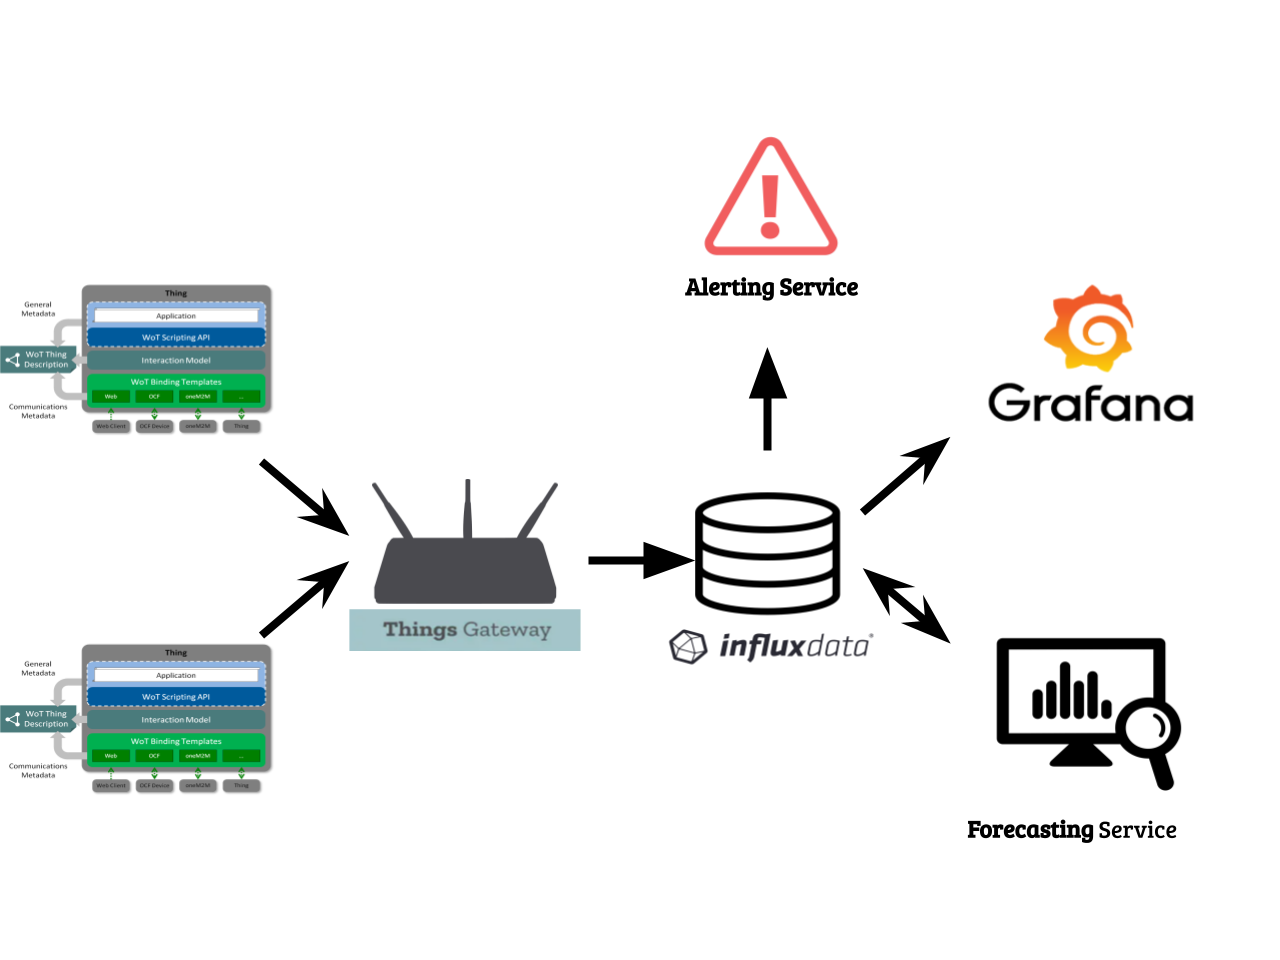
Two smart devices were built which were implemented as Web Things. These Things are detected by the Mozilla Gateway which acts as a single access point to upload data to InfluxDB. The data uploaded to InfluxDB are then analyzed to carry out forecasting operations on the levels of environmental parameters and the number of people in the environment. The visualization of the data is provided through the Grafana dashboards. In addition, an alerting mechanism has been implemented to notify the user through Telegram in the event that the parameters of the environment reach critical levels.
Hardware
Two NodeMCU single-board microcontrollers equipped with WiFi connectivity were used for the two objectives of the project: count the number of people inside the room; detect the environmental parameters.
In order to collect and display the data, a Raspberry Pi 3, a single-board computer with a 64-bit ARM CPU equipped with an external hard disk drive (HDD) was used.
What I learned
- Docker and Docker-compose: used to distribute software in isolated containers that have the ability to communicate with each other;
- Mozilla WebThings Framework and Mozilla WebThings Gateway: used to solve the problem of the findability of Things connected to the local network. It is also able to automatically manage reconnection with devices;
- InfluxDB 2.0: used as a database for saving data in the form of a time series;
- Grafana: used to allow an interactive display of the data obtained;
- Telegram: used to notify the user of alerting situations.
- Arduino language (C / C ++): for programming NodeMCU boards;
- Javascript / Typescript: for building services;
- Python: for the study and implementation of forecasting methodologies on data and the construction of the forecasting service;
- Bash scripting.